
It would be hard to have missed the vast quantities of water across parts of the UK over the past few months, but when water isn’t so obvious other ways are needed to track where water is, how much there is and what it is doing.
Monitoring of water is routine and carried out by the Environment Agency, water companies and local authorities, amongst others, and covers rivers, water and groundwater levels, pumping stations, overflows, sewage treatment works and rainfall levels. Many of these monitoring and gauging stations feed their results in automatically from remote or inaccessible locations meaning many measurements can be recorded without human interaction. In many cases measurements are captured every 15 minutes and fed back to the system daily; data as far back as 10 years ago is available for some gauges and monitors. Some of the Environment Agency’s gauges have been taking measurements for almost 40 years
This vast wealth of data is held and used by different organisations and, until recently, had never been combined to create a better understanding of what is happening in a region. Until that is, the Living with Water (LWW) Telemetry Integration project team collaborated through their partnership work to share various data sets.
The LWW partnership are working together with other organisations in this Catchment Telemetry Integration project to better understand what data is being routinely captured and where, and will be using it to identify ways for its use in improved forecasting and responses. Ultimately the data will be used to influence where future monitoring might be most usefully installed to provide the most useful data.
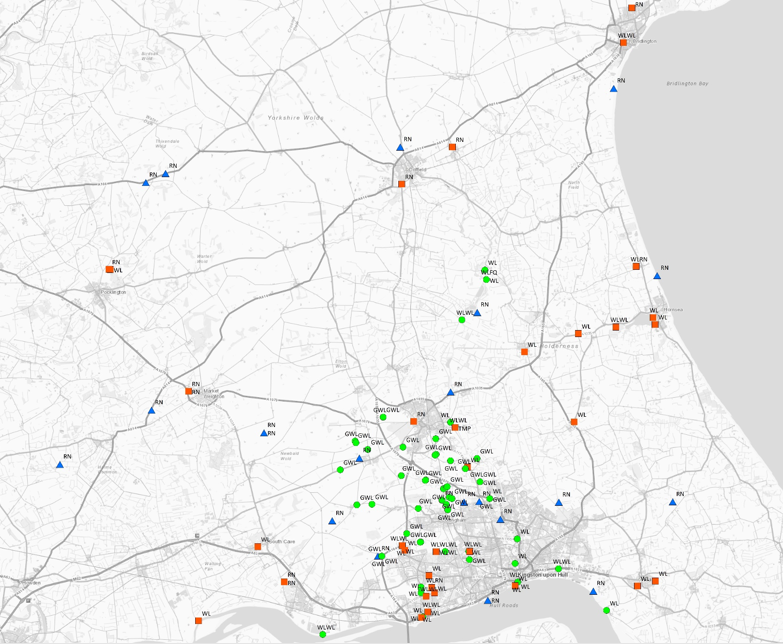
The project team produced the first ‘combined data’ maps earlier this year which show the locations and types of all the monitoring stations across Hull and East Riding, including how long they have been operating for.
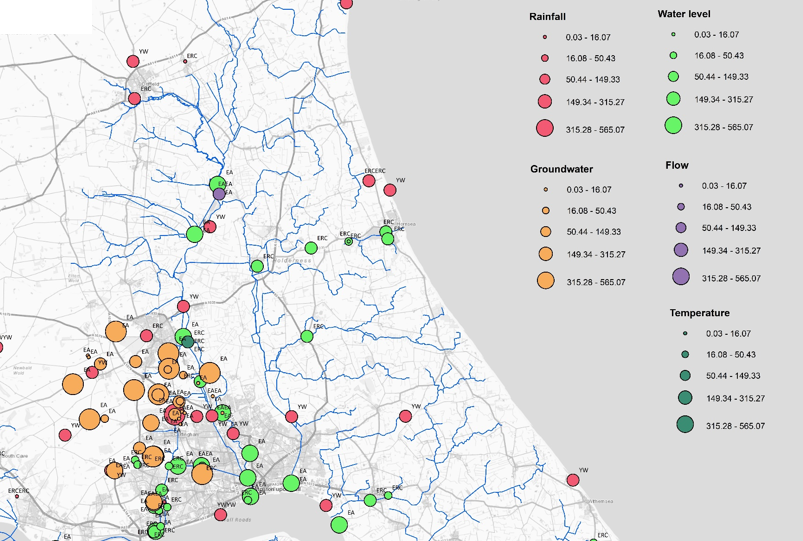
These maps are provisional results so far, but show the amount of monitoring already taking place across the region.
By sharing this data, and ultimately combining it with decision-making tools, the project team hope to develop an early warning tool that will help improve operational preparedness and improve response times at the outset of a flood risk event.